Table of Contents
ZENTRA Cloud 2.0 Release Logs
Release notes for ZENTRA Cloud 2.0
This article contains a log of release notes for ZENTRA Cloud 2.0.
2026
Jun
1 - 22
Added
Added forward and backward navigation to Explorer graphs, allowing users to jump by the currently selected period.
Fixed
- Fixed an issue preventing selection of four uploads per hour for High Data subscriptions.
- Fixed an issue where users could not uncheck email notifications when subscribing to alerts.
- Fixed a labeling mismatch between the device list and individual device views; both now display configured uploads per day.
- Fixed an issue where creating chart alerts from the Alerts page failed due to a missing data stream selection parameter.
- Fixed an issue where device configuration changes were not being saved by the backend.
- Fixed an issue where the chart lightbox appeared empty when opened from the dashboard.
- Fixed an app crash triggered when selecting a device with wind speed measurements.
- Fixed an issue where water content data was not displayed for all soil moisture sensors.
- Fixed an issue where chart data did not display after saving changes until the page was refreshed.
- Fixed an issue where chart cloning could fail.
- Fixed a delay when updating chart names.
- Fixed an issue preventing users from unassigning a group from an alert.
- Improved enforcement of viewer access restrictions in the v5 API.
May
12 - 31
Added:
- The Integrations page under the user account is now available to all users. View and copy your API Token ID.
- The updated ZENTRA Cloud 2.0 status page allows users to subscribe to uptime status notifications.
- Updated terminology across the platform - "Projects" are now called Workspaces.
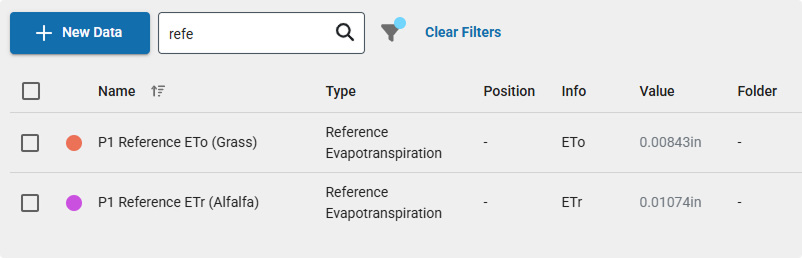
- ETo is now the default model variant when creating a custom evapotranspiration (ET) model.
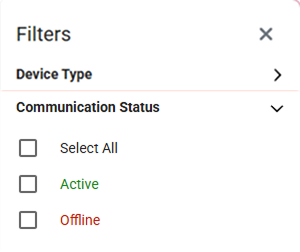
- Added the ability to filter the device list by communication status: Active or Offline.
- The Datastreams table now includes model type or model variant information in the Info column.
Fixed:
- Prevented devices from being moved between organizations while data reprocessing is in progress. The option is now disabled during reprocessing to avoid errors.
- Fixed an issue where deleting a project did not refresh the page.
- Resolved an error that could occur when deleting an organization.
- Fixed a delay where updates to a device’s folder were not immediately reflected in the UI.
- Resolved an issue where adding a device could fail if no location was specified.
- Removed serial number case sensitivity in the v5 API. Previously, ATMOS 41W required uppercase, and ZL6 required lowercase.
- Fixed a layout issue on mobile where the logs view was offset off-screen.
- Prevented folder names from being created with only whitespace or trailing spaces.
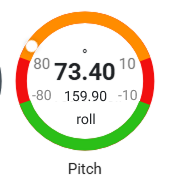
- Updated pitch and roll labels on the gauge element for better clarity.
- Fixed an issue where clearing the data stream type did not clear the input field when selecting “x”.
- Resolved download failures for custom graphs and devices containing evapotranspiration measurements.
- Fixed UI overlap between the filter panel and the device “more” menu.
- Removed erroneous message shown after creating a new Workspace.
- Users with pending invites can no longer be added to notification groups.
- Updated messaging clarifies that invited users won’t receive notifications until they accept.
- Fixed charts exceeding bounds (upstream fix from chart provider applied).
1 - 11
Added:
- The Explorer chart now defaults to the currently selected period when opening the download modal.
- ETo (grass reference) model data columns in downloads are now ordered after standard measurements and before system fields (e.g., battery, signal).
- Added the ability to enable or disable device-related alerts without requiring deletion.
Fixed:
- Fixed an issue where elevation overrides were not updating correctly in the frontend UI.
- Resolved a bug causing TEROS 06 depth metadata to not display alongside measurement traces.
- Prevented the creation of unnamed folders, which could not previously be assigned or edited.
- Corrected datetime formatting in API responses to use T for strict ISO 8601 compliance.
- Fixed an issue preventing dashboards from being renamed.
- Resolved a bug where low battery alerts showed no corresponding event activity in charts.
- Fixed a crash that could occur when updating axis colors in custom graphs.
- Fixed an issue where clearing the search field in Notification Groups removed previously added members.
- Resolved an error that occurred when project editors attempted to view custom charts.
- Corrected communication status for Wi-Fi devices.
- Fixed an application crash when navigating to the last device in long device lists.
- Resolved inconsistencies between accumulated solar radiation values and table sums.
- Fixed missing data columns in TEROS 54 downloads.
Apr
14 - 30
Added:
Evapotranspiration (ETo Grass) Auto-Model
- Added an ETo (Grass) auto-model for ATMOS 41 / 41W weather station sensors. This model output is now included by default in:
- Datastreams
- Device data downloads
- API responses
Email Alerting for Targets
- Introduced email-based alerting for targets with support for:
- Target ranges and threshold-based alerts
- Notification groups for managing alert recipients
- Two configurable alert types:
- Chart-based alerts
- Device battery monitoring alerts
- Customizable battery alert thresholds via a slider control
Fixed:
- Fixed an issue where sorting devices by status did not work correctly.
- Resolved an issue where the precipitation table was not displaying on the default charts view.
- Improved error handling so downloads requested with no available data now return a more specific and helpful error message.
- Fixed an organization timezone issue that could cause page crashes.
- Improved the mobile measurement selector:
- Now displays the currently selected parameters
- Fixed the modal so selected parameters persist and display correctly when re-opened
1 - 13
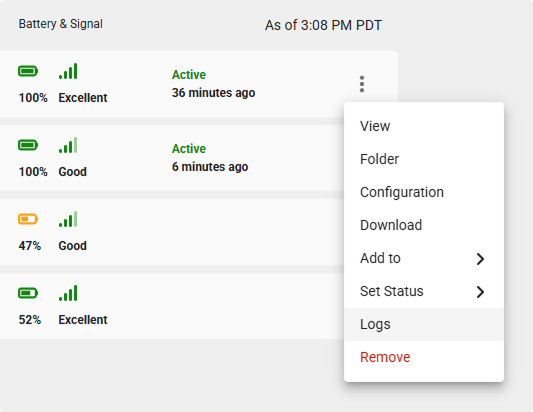
Device Logs
- Added the ability to view device-level logs for supported devices (e.g., ZL6, ATMOS 41W) to help with troubleshooting and monitoring device performance.
- Logs capture device activity, data uploads, errors, and configuration changes, providing better visibility into device behavior over time.
- Logs can be searched, filtered, and downloaded to support diagnostics and offline analysis.
- Device Logs are accessible from the more menu on the device.
Pitch & Role
- Added a Pitch Gauge for the tensiometer (e.g., TEROS 32).
Fixed:
Models
- Fixed an issue where updating the input for models such as GDD would fail.
Filters
- Fixed an issue where searching for a device name in filters returned no results.
- Added a filter option to the Create New Datastream flow. Selected filters now persist when navigating between pages.
- Updated the filter side panel so it pushes content to the side rather than displaying over it.
- Added support for port and folder in the datastream search field.
Graphs & Downloads
- Fixed an issue where precipitation sum values did not display on default device graphs.
- Fixed a mobile issue where the download period selector was not selectable.
- Fixed an issue where selecting Download on an Explorer graph did not trigger a download.
Devices & Data Management
- Fixed an issue where assigning a device folder to None incorrectly created a folder named “None” instead of clearing the assignment.
- Improved the error message shown when attempting to add a device that is not on the US server when creating your first organization.
Sensors & Measurements
- Corrected an issue where all depths for the TEROS 54 sensor were displayed as 60 cm.
- Addressed an issue where the measurement order was inconsistent between the TEROS 12 and SOLYX 14 sensors.
- Fixed an issue where drainage calculations used an incorrect aggregation method. Aggregation now correctly uses the last value.
Mar
17 - 31
- Imported the latest translation keys to improve language consistency, accuracy, and coverage across the platform.
- Reduced the water content limit for calculating Pore Water EC and Saturation Extract EC from 15% to 5% for SOLYX water content sensors, extending the range of the modeled outputs.
Fixed:
Data Integrity & Migration
- Reprocessed devices with incomplete data imports carried over from ZC 1.0.
- Corrected an issue where custom calibrations were not applied retroactively to existing data.
- Fixed a bug where soil calibration updates did not persist after saving.
Calibration & Sensor Configuration
- Custom calibrations now reliably apply after saving.
- Soil sensor position now correctly defaults to depth, rather than height.
Downloads & File Handling
- Fixed an issue causing All Data downloads to fail when selecting the Excel file format.
- File attachments added during feedback now persist properly even if the user closes the form before submitting.
Projects, Organizations & Visuals
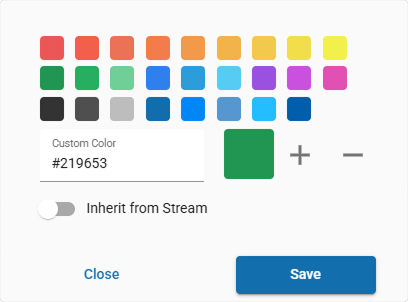
- New organizations now correctly receive the default color palette.
- Additions or edits to project color palettes now save consistently.
- Resolved an issue where deleting a target caused the app to crash.
- The target range delimiter has been updated for improved clarity and user understanding.
- The Save button on custom charts no longer stays active after saving.
- Fixed inconsistencies where organization color palette changes did not persist.
Models & Calculations
- Addressed an issue in the GDD model that occurred when measurement intervals were ≥ 60 minutes.
Authentication & Account Access
- Users can now successfully switch to a different account after logging in with Google.
- Fixed various reliability issues affecting Sign in with Google.
Device Management
- Fixed an issue where an error message incorrectly displayed when adding a device, despite successful device creation.
3 - 16
- Enhanced Organization Naming. Organization names now support the use of parentheses “(” and “)”.
Fixed:
Device & Organization Management
- Fixed an issue where users were unable to clear the search field on the Archive tab.
- Resolved a problem preventing users from saving device moves to a new organization.
- Corrected a bug that caused devices to fail to archive.
- Device configuration pages now correctly reflect the new organization after a device is moved.
- Calibration values no longer display N/A incorrectly in sensor configuration.
- Addressed an issue where ECT/RT‑1 sensor temperature measurements were not properly supported in models.
Projects & Charts
- Fixed various Project-related bugs impacting navigation and configuration.
- Resolved issue where users could not delete a chart with unsaved changes.
- Selecting a parent folder now correctly selects all subfolders.
- Fixed chart behavior where new data did not display until after saving.
- The bar units chart type no longer crashes during chart creation.
- Improved validation and flow for entering negative values in targets.
- Corrected behavior when entering small decimal values (e.g., 0.09) for targets.
- Canceling with unsaved chart changes now properly resets the state.
General UI & Functionality
- The main menu on mobile no longer overlaps UI elements.
- Users can now reliably download device and chart data.
- Custom soil calibration forms can now be saved successfully.
Feb
- Added a feature to clone dashboards.
Fixed:
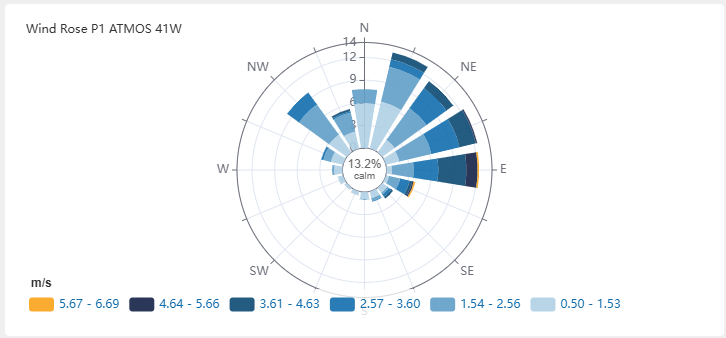
- Fixed issues with the Wind Rose chart.
- Fixed issues with CSV and Excel downloads.
- Fixed UI flicker on first page load.
- Fixed the password reset linking to the wrong page.
Jan
- Published the v5 API documentation page.
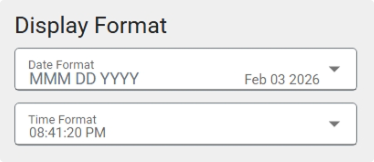
- Added date and time display format options for the organization.
Fixed:
- Fixed ordering issue with wind rose legend.
- Fixed date picker menu closing on mobile.
2025
Dec
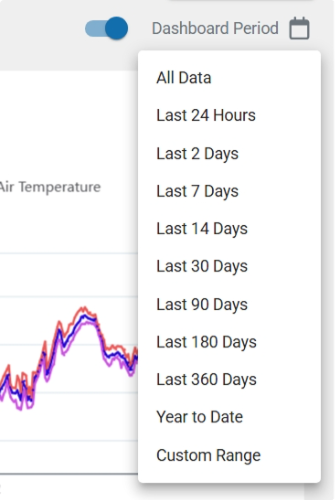
- Added a dashboard date picker so the period for all charts on a dashboard can be synced.
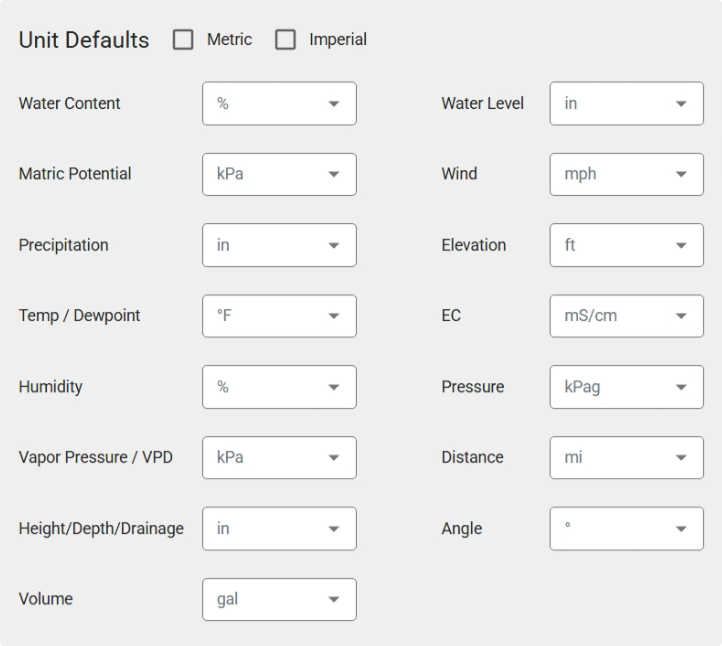
- Added a quick select checkbox for Metric and Imperial units.
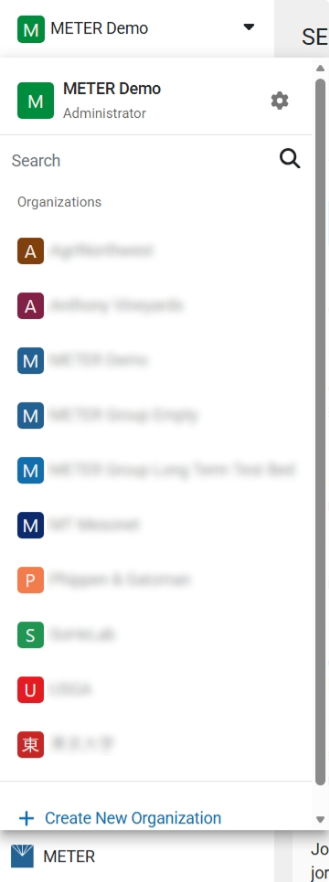
- Updated the organization dropdown with user role, gear icon to settings, and Create New Organization button.
Nov
- Added data aggregation info to graphs (Unaggregated, aggregated hourly, etc).
- Newly created targets now auto-add to the current graph in Explorer.
- Support for stitching default data streams added.
Oct
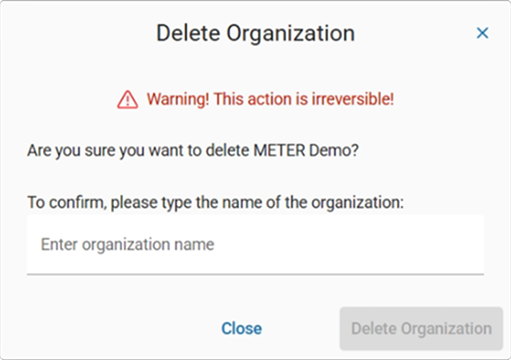
- Added a delete organization option with a field to type the name of the organization to confirm.
- Flattened selection of models by bringing all models to the top-level menu in New Data.
Fixed:
- Updated search for time zone name.
Sep
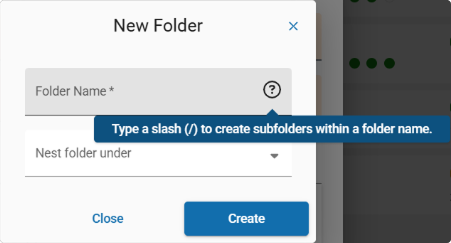
- Use a slash "/" to create subfolders when creating new folders.
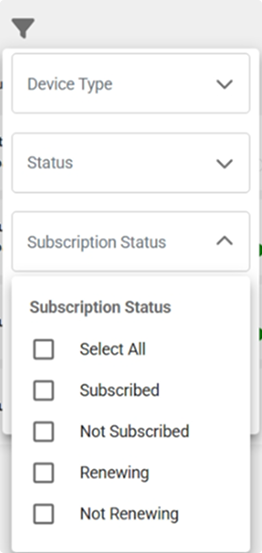
- Added filter for device subscription status.
- Added option to temporarily hide plotted data on Explorer.
- Added multi-select on device grid view.
- Added sort device list option for mobile.
Fixed:
- Fixed dashboard sort not working.
- Updated navigation accessibility for keyboards.
Aug
- Device firmware version added to device view.
Jul
- Charts: Disabled spline smoothing on graphs.
- Filters: Filters now persist across sessions.
Jun
- Device Charts: Added wind rose and wind direction to default device charts.
- Filters: Updated the filter for data streams and improved the performance.
- Fixed:
- Fixed issue with Utah Chill Model.
- Fixed issues with inline statistical metrics.
May
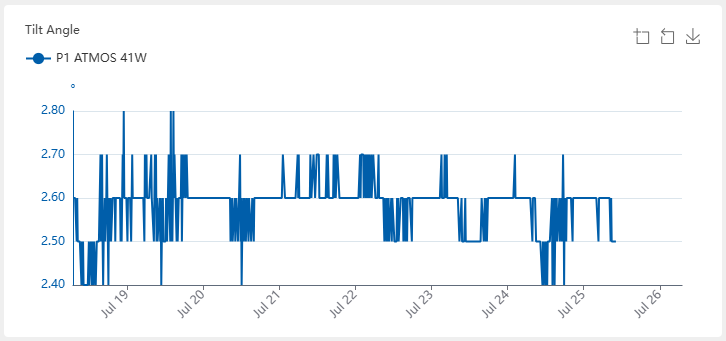
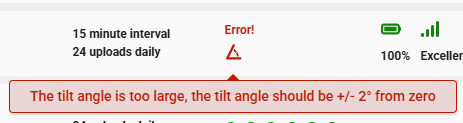
- Device Charts: Added tilt angle to default device charts.
- Data: The "New Data" feature on the data page is now available to all users. Create new data streams, including supported models.
- Explorer Statistics: This feature is now fully released to all users.
- Projects: Devices can now be added to a project from the device more menu.
- Fixed:
- Fixed page crash when selecting PAW as a model.
- Fixed issue with newly created location folders not shown until after page reload.
Apr
- Statistical Metrics: Custom charts can now include a table and inline stats, providing more detailed insights into your data.
- Port Status: Updated the ATMOS 41W port status to use icons that identify the status.
- Charts: Added aggregation data to the chart tooltip.
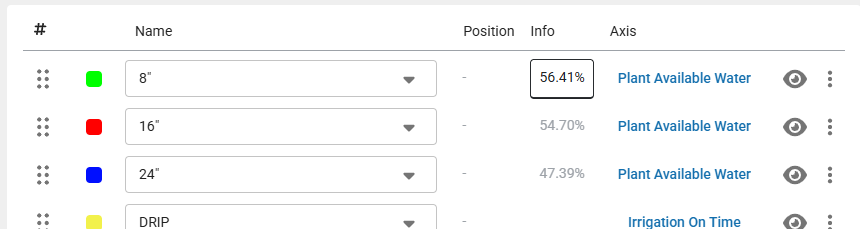
- Plant Available Water: PAW models can now be edited from the Explorer.
- Projects: This feature is now available to all users.
- Fixed:
- Fixed issue with table stats not displaying the total for precipitation.
- Fixed ATMOS 41 not being listed as available for Daily Light Photoperiod.
Mar
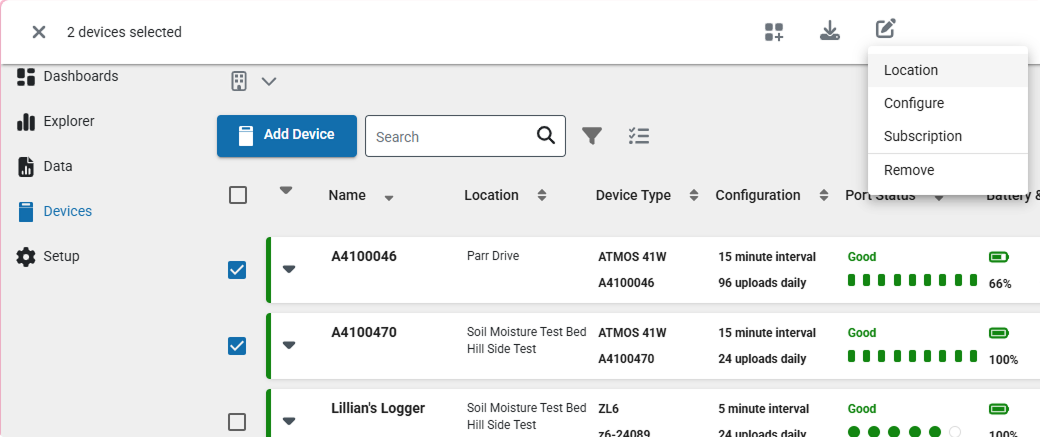
- Bulk Edit Location: You can now edit the folder location for multiple devices at once, streamlining your organizational process.
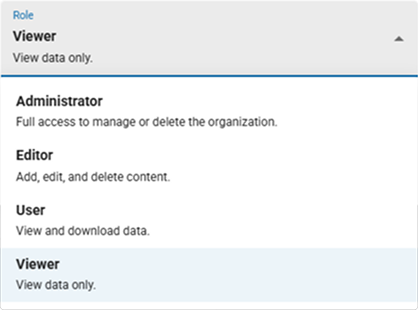
- New Role - Viewer: The Viewer role has been introduced, allowing users to view data without the ability to download it.
- Inherit Color: The trace color in custom charts can now be reset to match the source color, ensuring consistency in your visualizations.
- Device Info: The collapse or open state of device details is now saved to local storage, remembering its state when you revisit the page.
- Projects: This feature is now available to all users, offering early access to new project functionalities.
- Fixed
- Fixed page crash on Firefox.
- Fixed issues with chart period selection.
- Corrected minor layout issues and improved accessibility.
- Fixed some dropdown lists that jumped after selection.
Feb
- New models: We are excited to announce the addition of models to support unique applications. These models are designed to enhance your analysis by creating decision-making data. The new models include:
- Chill hours: Measure the cumulative hours of cold temperatures required for certain plants to break dormancy.
- Chill portions: Calculate the portions of chill required for optimal plant growth.
- Daily light integral: Assess the total amount of light received by plants each day.
- Daily light photoperiod: Track the duration of light exposure for plants on a daily basis.
- Evapotranspiration: Estimate the amount of water transferred from land to the atmosphere through evaporation and plant transpiration.
- Groundwater depth: Monitor the depth of groundwater levels.
- Groundwater elevation: Measure the elevation of groundwater above sea level.
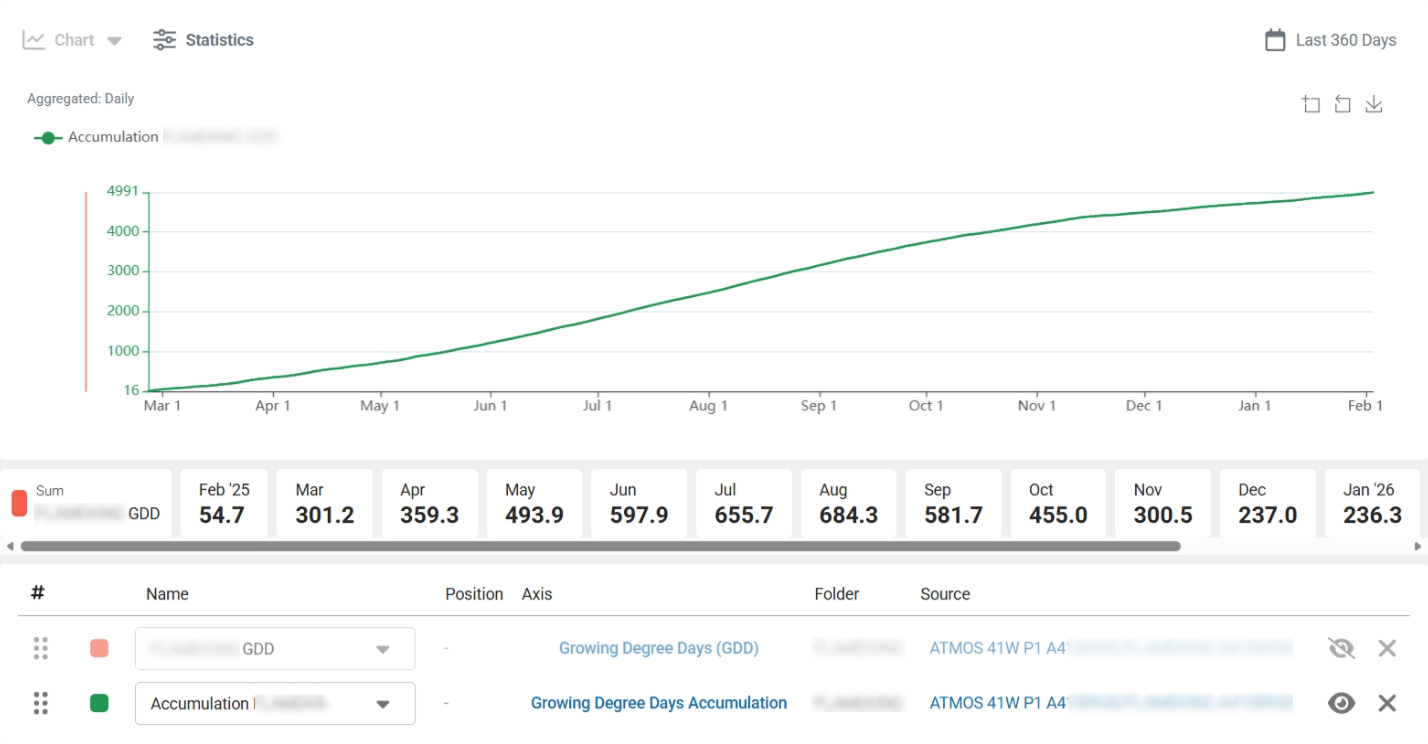
- Growing degree days: Calculate the accumulated heat required for plant development.
- Growing degree hours: Measure the hourly accumulation of heat for plant growth.
- Leaf wetness amount of water: Track the amount of water present on plant leaves.
- Wind chill: Assess the cooling effect of wind on temperature.
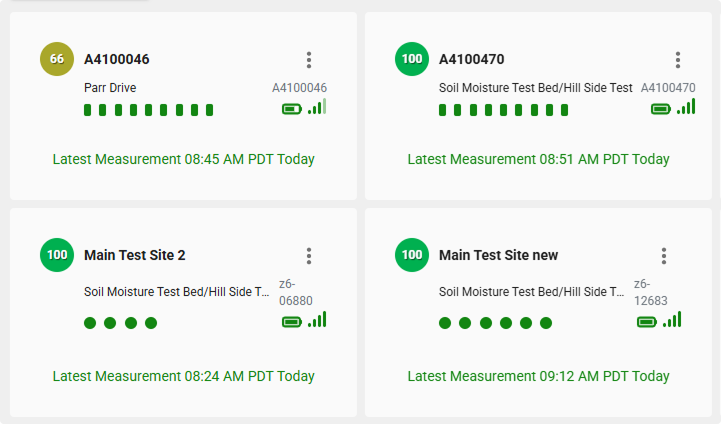
- Grid View for Devices: Enhance the way you consume the latest measurements. You can now choose between two viewing options:
- Grid View: Display devices in a grid format for a more visual and organized layout.
- List View: View devices in a list format for a detailed and linear arrangement.
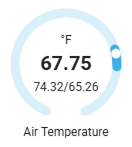
- Gauges for Device Readings: You can now choose between two viewing options for each sensor port:
- Gauge View: Display the latest device readings as gauges for a more visual and intuitive representation. The gauge view also includes max and min values where appropriate.
- Value View: View the latest device readings as simple numerical values for a more compact and straightforward analysis.
- Fixed
- The chart period is now saved to the dashboard.
- Removed RAW as a unit option.
- Fixed issues with navigation.
Jan
- Start a New Chart from Chart Editor: You can now directly start creating a new chart from the editor without needing to return to the Explorer main page, streamlining your workflow.
- Improved Device Search in Projects: Enhanced search functionality for devices within projects, making it easier to find and manage your devices.
- Targets: You can now create and add targets for Range, Threshold, SUM, and Delta to your charts, providing more precise and customizable data analysis.
- New Unit Options: Added new units for mS/m and dS/m, expanding the range of measurement choices available for your data.
- No Data Message: Added a message for charts that contain no data, ensuring clear communication when data is unavailable.
- Fixed
- Fixed issue where the phone number was not optional when editing your profile.
- Fixed issues with the dashboard layout.
- Fixed issue where the Add To would close on Safari mobile.
- Fixed app crash when leaving the profile page.
2024
Dec
- Dashboard: You can now create custom dashboards, add charts to them, resize charts, and drag to reorder them on the dashboard. This provides a more personalized and flexible way to organize and view your data.
- Explorer: The explorer editor allows you to create custom charts with full control over naming, colors, axes, legends, and more. Tailor your charts to meet your specific needs and preferences.
- Fixed
- Improved the date range picker for custom date ranges.
- Fixed the period selection for default chart periods so it persists.
- Fixed a display issue for the axis bounds label.
- Fixed the fullscreen map from covering the toolbar.
- Fixed the device view page not loading.
- Fixed issue that caused crash when viewing source.
How did we do?
ZENTRA Cloud 1.0 Release Logs