Data Collection & Telemetry
Overview
Update Hardware
Module and SIM Update Guides
Module Identification
Module Swap Wizard
SIM Swap Wizard
AT&T / T-Mobile Configuration Guide
Verizon Configuration Guide
Worldwide H1 SIM Configuration Guide
SIM Replacement Instructions
Wi-Fi Configuration Guide
Firmware Update
Troubleshoot
ZL6 Troubleshooting Guide
ATMOS 41W Troubleshooting Guide
EM60G Troubleshooting Guide
EM50 Series Troubleshooting Guide
Communication Test
List Cellular Carriers
Test Button & Status Lights
Fix: Retroactively Enable LTE-M Bands for 4G in Europe
Sensor Current Draw Check - ZSC
App Location Permissions on iOS and Android
Coverage
Accessories
ZENTRA Cloud 1.0
Quick Start
Organizations
Account
Edit Account Profile
Update Account Password
Lost Password/Password Reset
Set Measurement Unit Preferences
Users
Devices
Device Inventory
Edit Device
Re-provision ZL6 to European Server
Add Device
Remove Device
Time-zone and Location Override
Calibrations
Downloads
Dashboard
Enable Chart Status
Create Custom Charts
Color Picklist
Add Traces to Chart
Chart Stats
Print Charts
Set a Target Range
Lock Chart Axes
Chart Date Range Picker [NEW]
Download Chart Data
Notifications
Models
Daily Light Integral
Ground Water Elevation
Ground Water Depth
Plant Available Water
Daily Light Photoperiod
Chill Hours
Growing Degree Days
Create a Model
Evapotranspiration
Subscriptions
Error Codes
Applications
FAQ
ZENTRA Field
ZENTRA Cloud 2.0
Frequently Asked Questions
Introduction to 2.0
Getting Started
User Account
Setup
Loggers
Add Data Logger
Configure Data Logger
Device Map
Data Logger Charts
Download Data Logger
Logs
Archive
Handhelds
Dashboards
Explorer
Data
Workspaces (Projects)
Alerts
Environment Models
Chill Hours [2.0]
Daily Light Integral [2.0]
Daily Light Photoperiod [2.0]
Evapotranspiration [2.0]
Groundwater Elevation [2.0]
Groundwater Depth [2.0]
Growing Degree Days [2.0]
Heat Index [2.0]
Heat Stress Wet Bulb Globe Temperature WBGT [2.0]
Leaf Wetness Amount of Water [2.0]
Plant Available Water [2.0]
Utah Chill Model [2.0]
Wind Chill [2.0]
Subscriptions
Feedback
API
v3.0/4.0
US Server API
EU Server API
TAHMO Server API
Push API
R Package
API Troubleshoot
AgWeatherNet & DAS
Manage API Keys
v5.0
Metadata
Release Notes
Accessibility
Security
Uptime & Incidents
Legal
- All Categories
- ZENTRA Cloud 1.0
- ZENTRA Field
- ZENTRA Field
ZENTRA Field
Quickly look at your data in the field with this lite version of ZENTRA Cloud. Download the app on the Android or Apple App store.
Quickly look at your data in the field with this lite version of ZENTRA Cloud
Download the app:
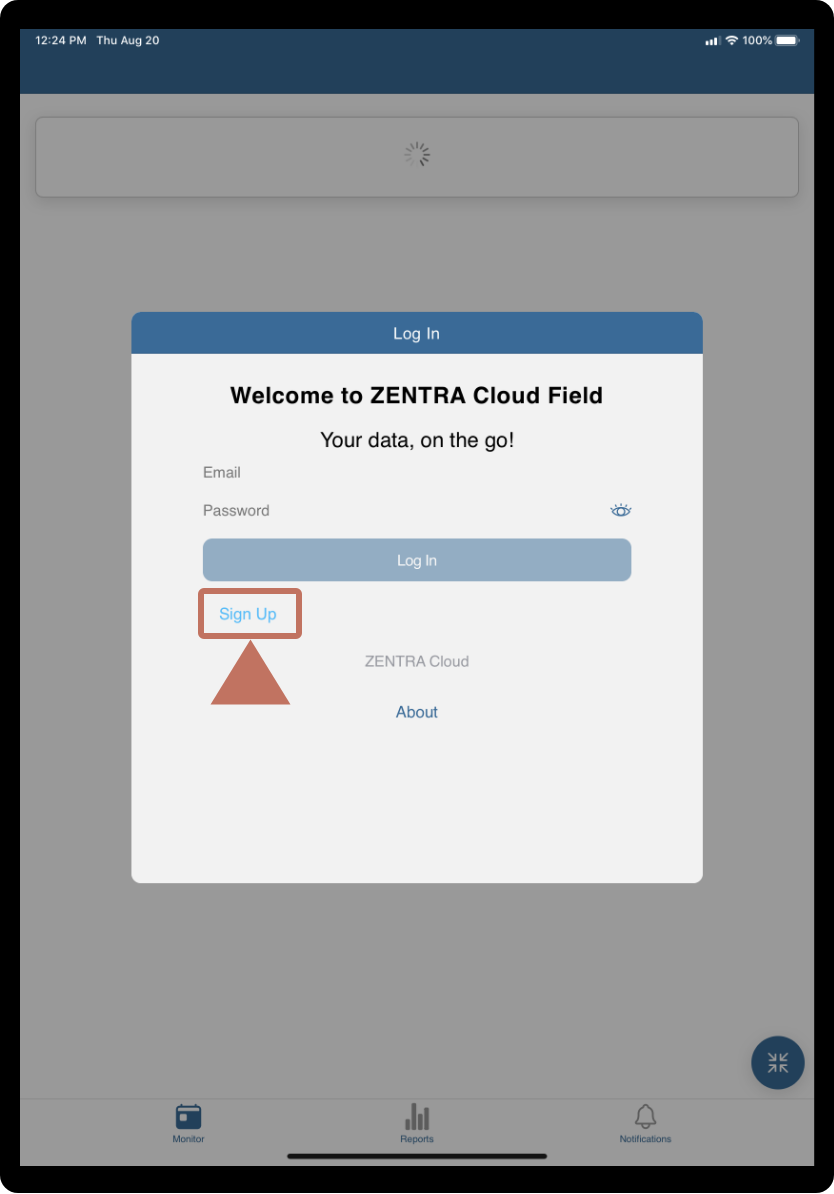
If you don’t have an account the Sign Up button will take you to the ZENTRA Cloud main page to create an account before you can log in to the app.
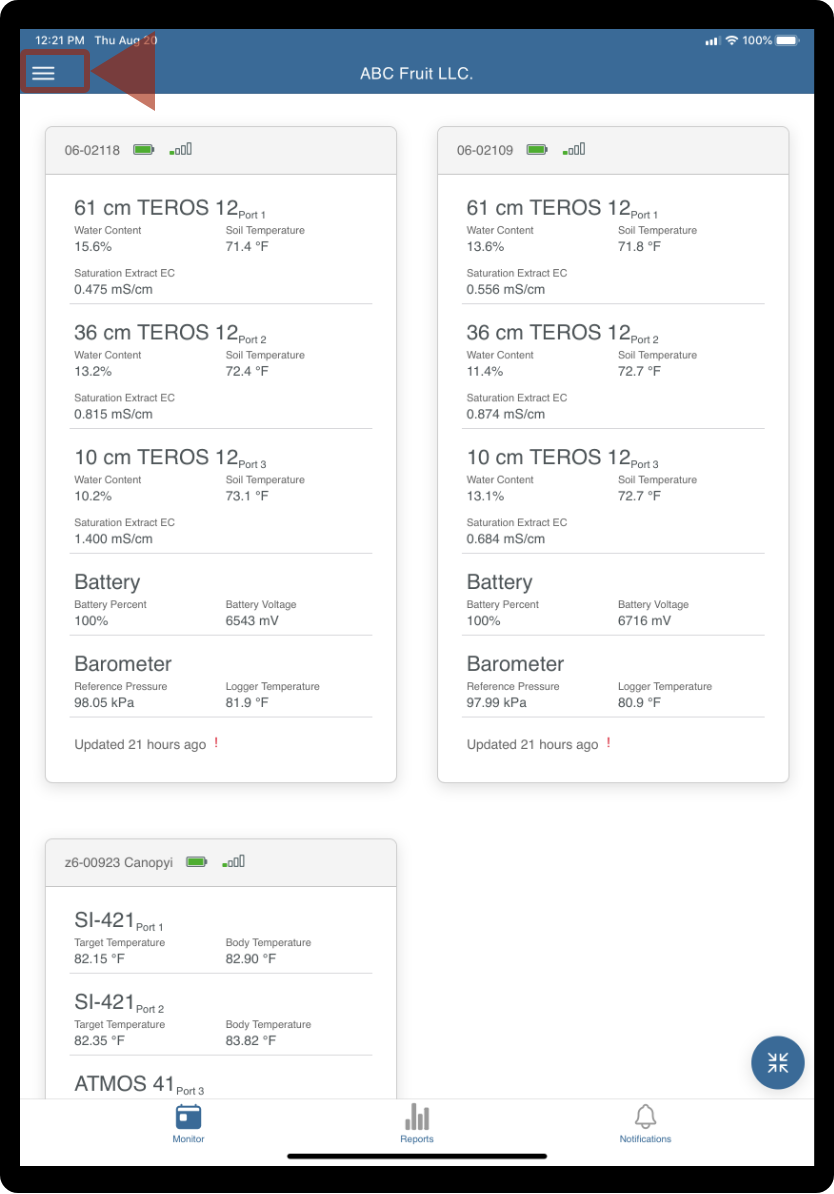
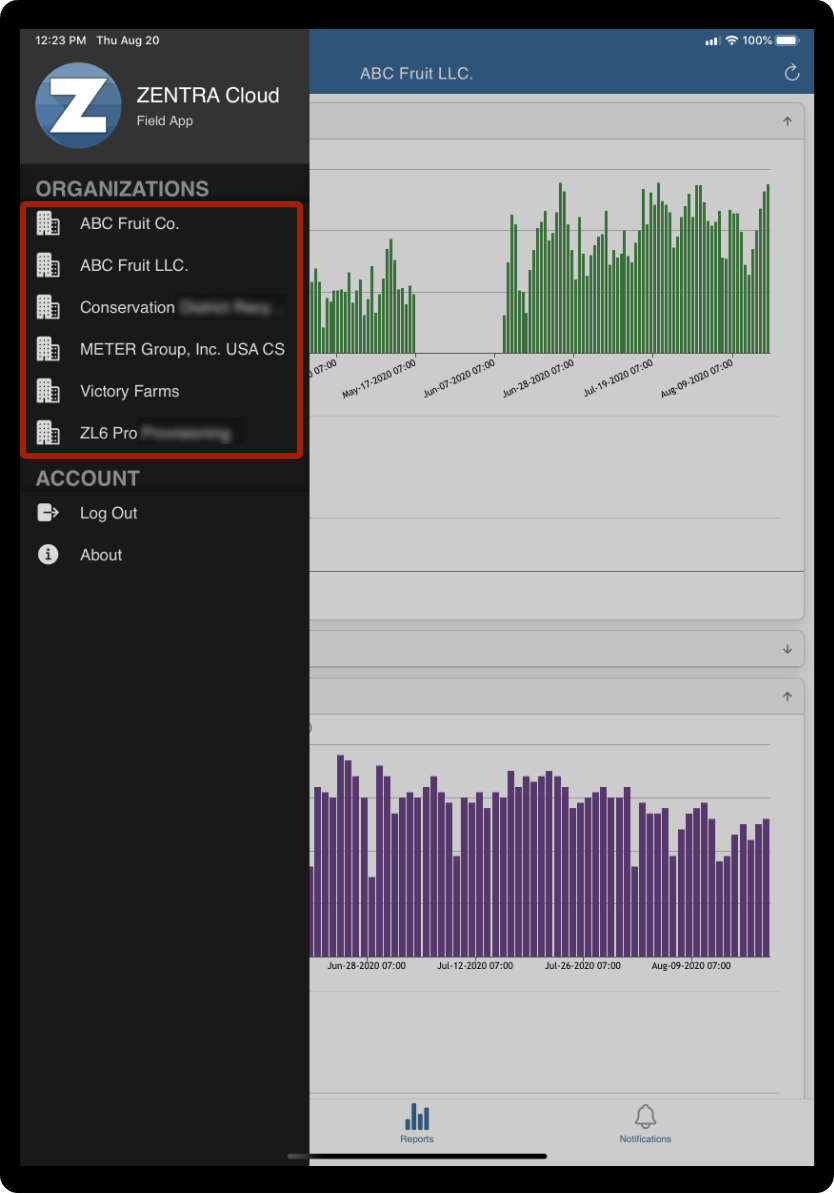
Upon login, the app will open the first Organization in your list. To switch organizations select the menu icon.
Select the desired organization.
On the monitor page, data will be grouped by device and show the last received measurement.
A red exclamation icon indicates when a device has not talked to the server in the last 24 hours.
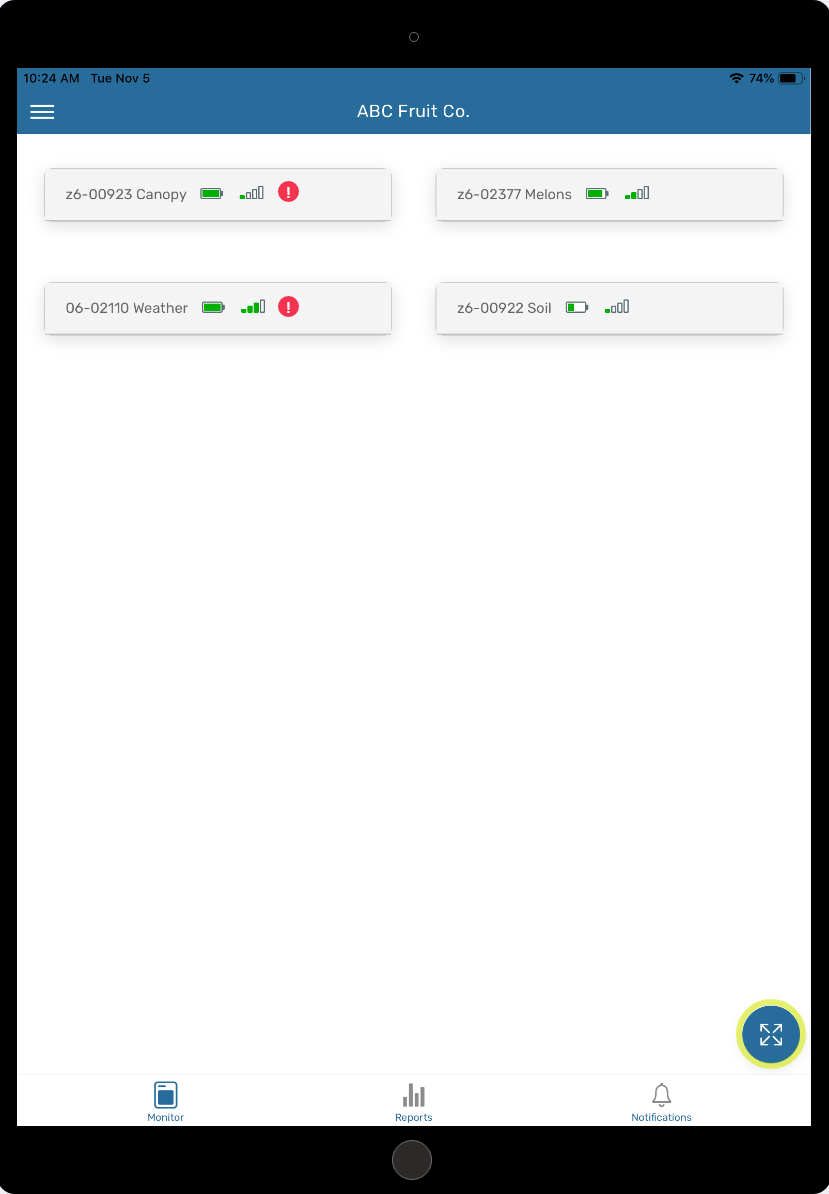
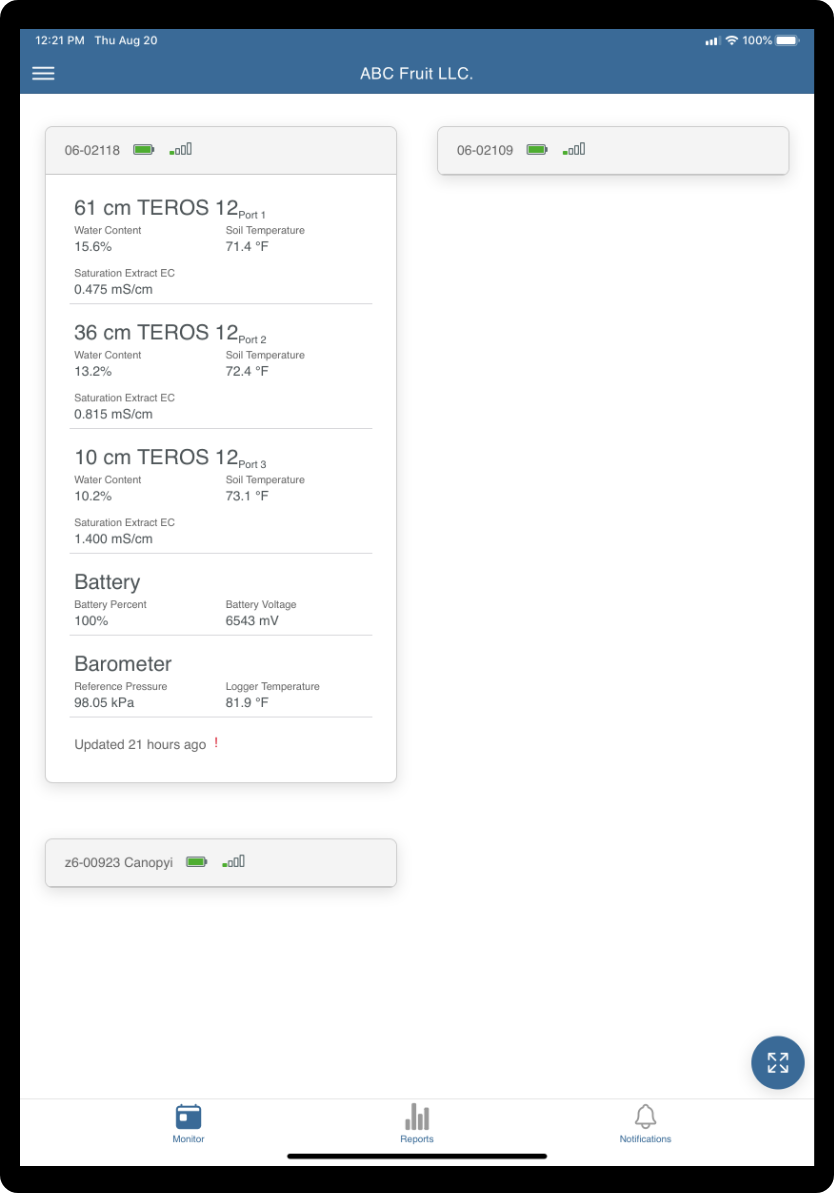
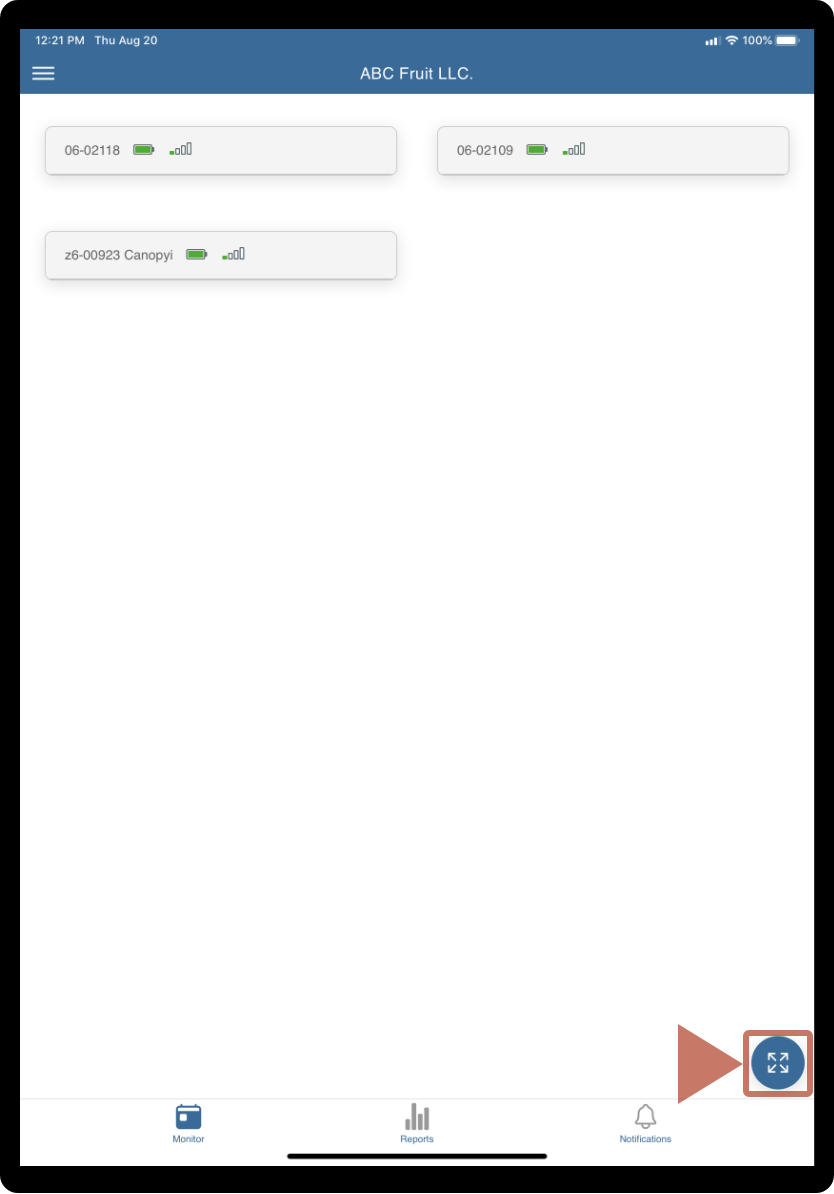
To collapse the data display and view only battery and signal strength for all devices tap the icon in the lower right. To expand tap the icon again. You can expand and collapse the data displays by individually clicking on a device as well.
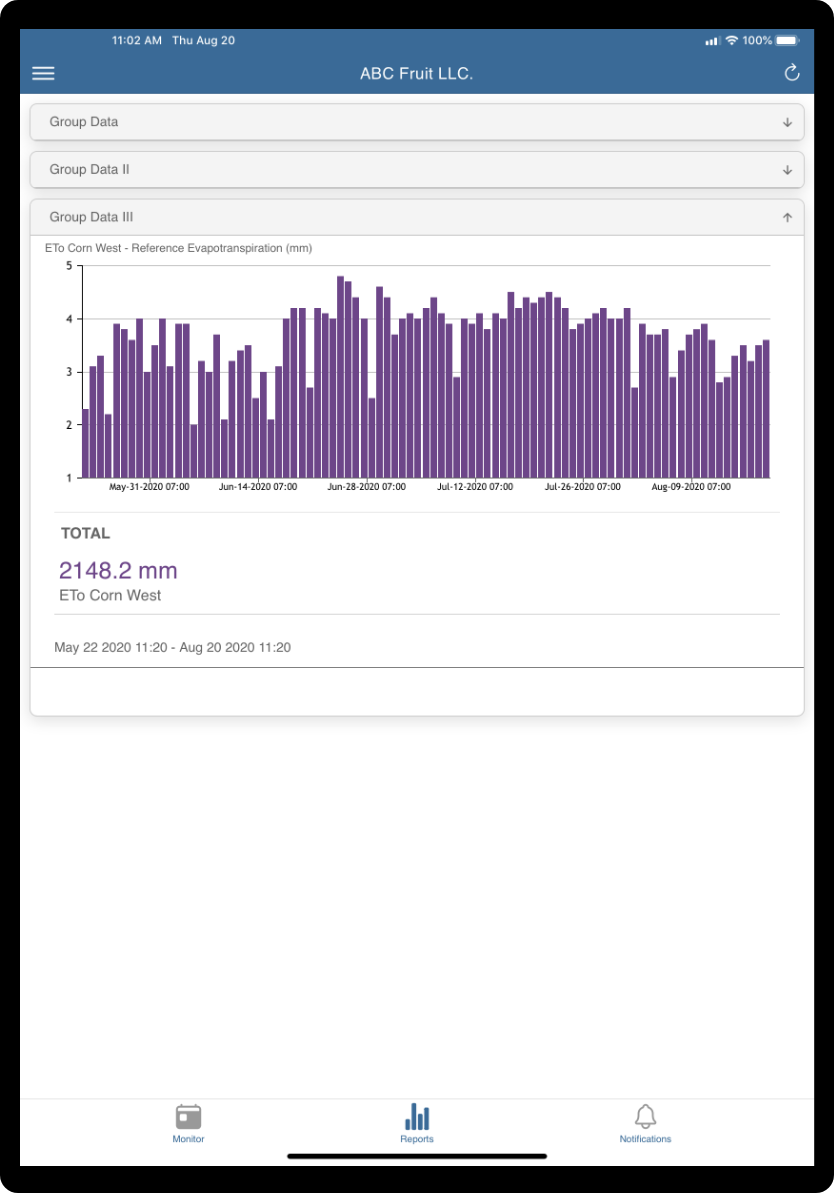
The reports page will have your custom made charts from the Dashboard page in ZENTRA Cloud. Tap to expand a report and view the associated charts.
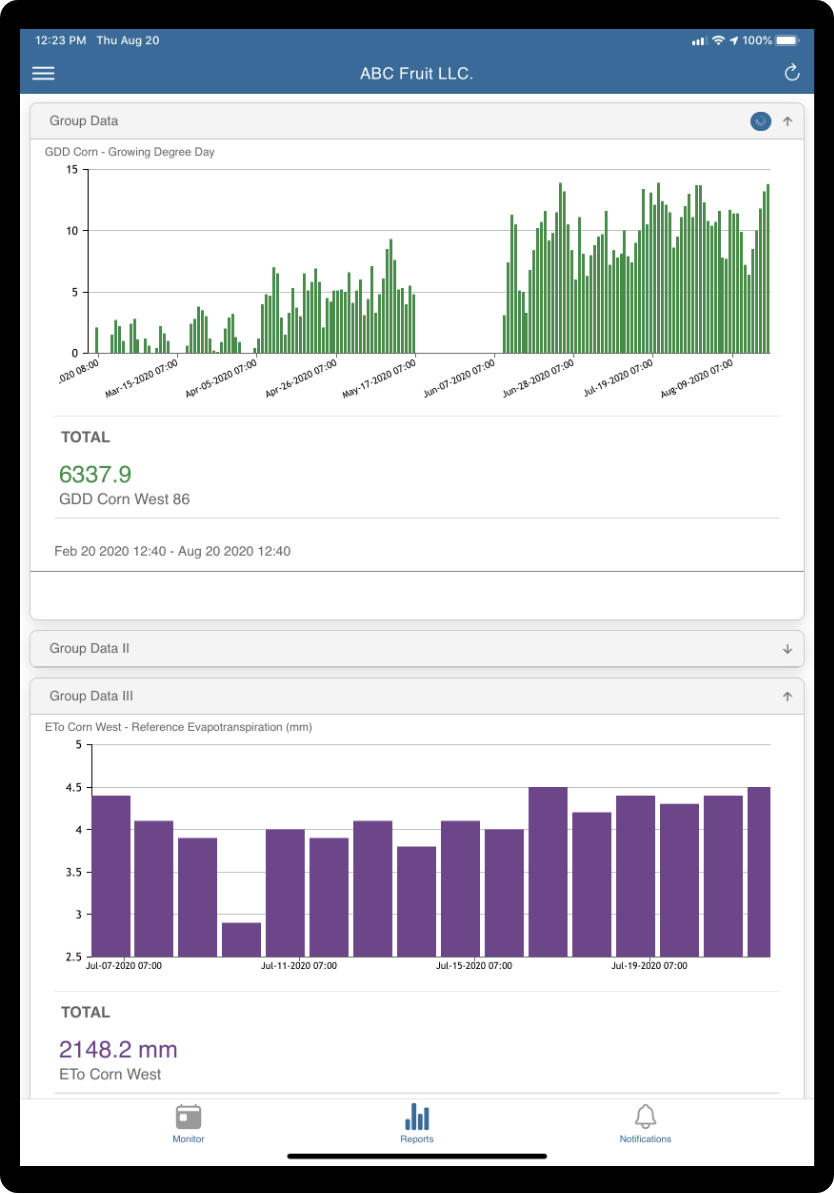
To zoom in on a chart Hold and Drag horizontally.
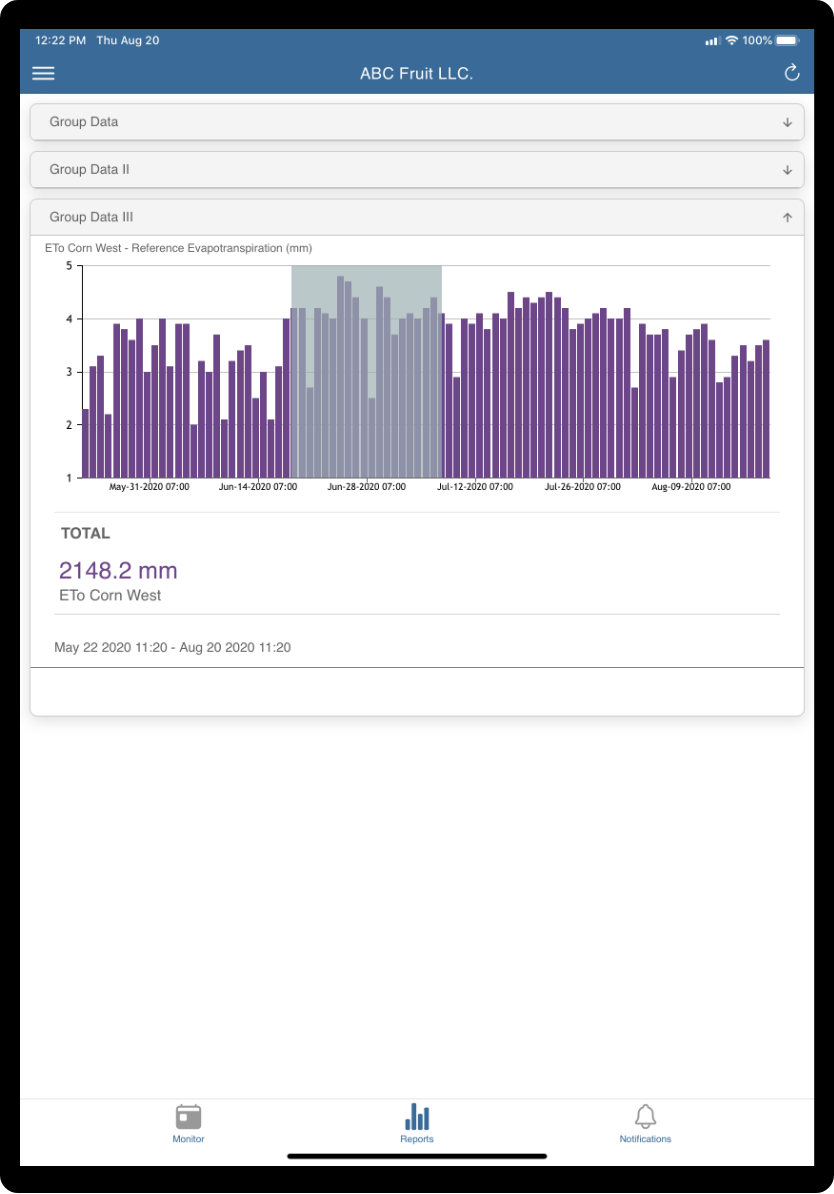
To return the chart to the default display period tap the refresh icon.
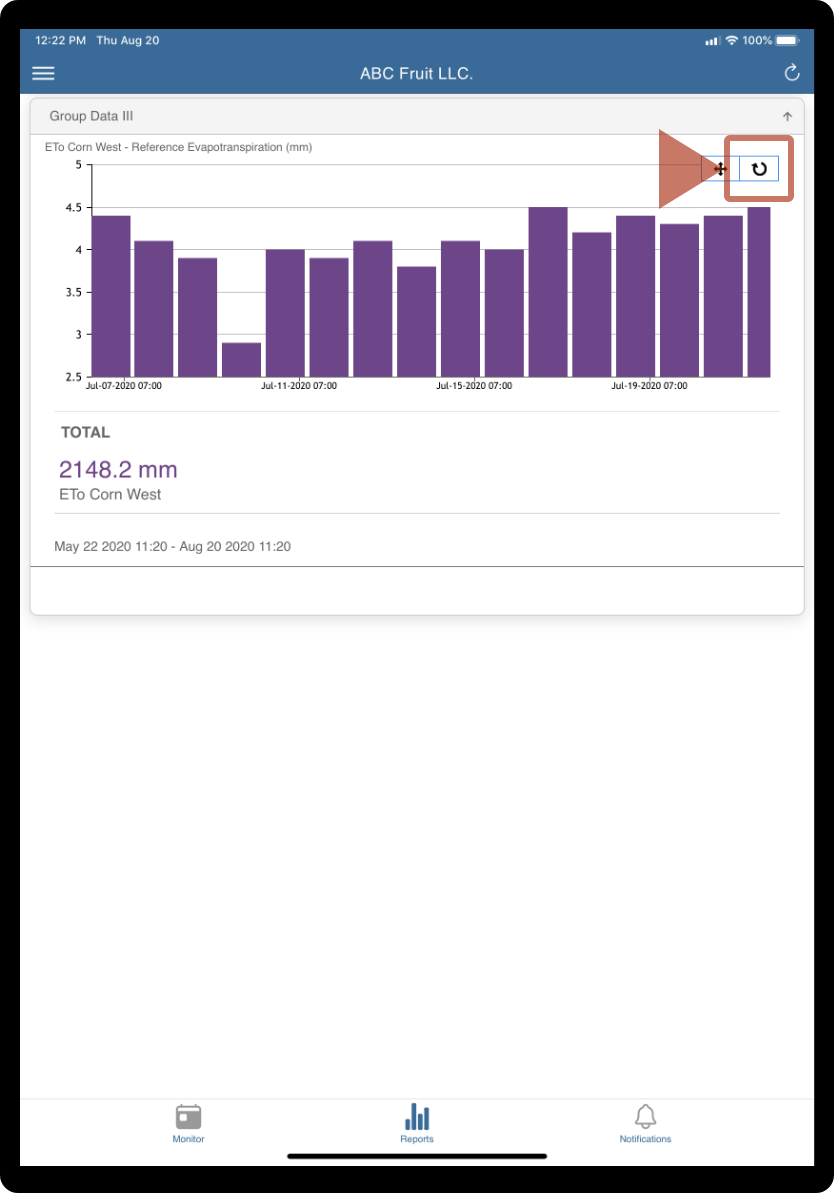
Chart stats are displayed at the bottom of the chart. See our guide here on how to setup stats from the website.
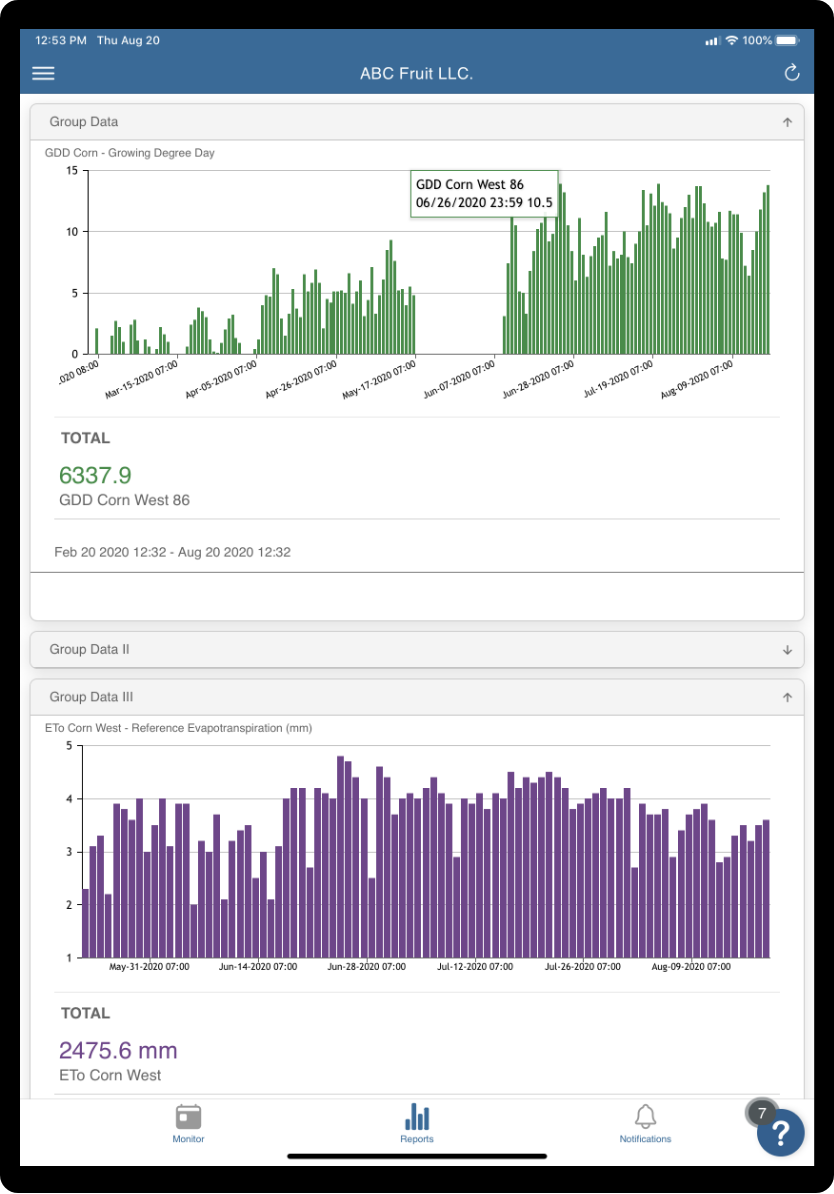
Tap a trace to see its name or value.
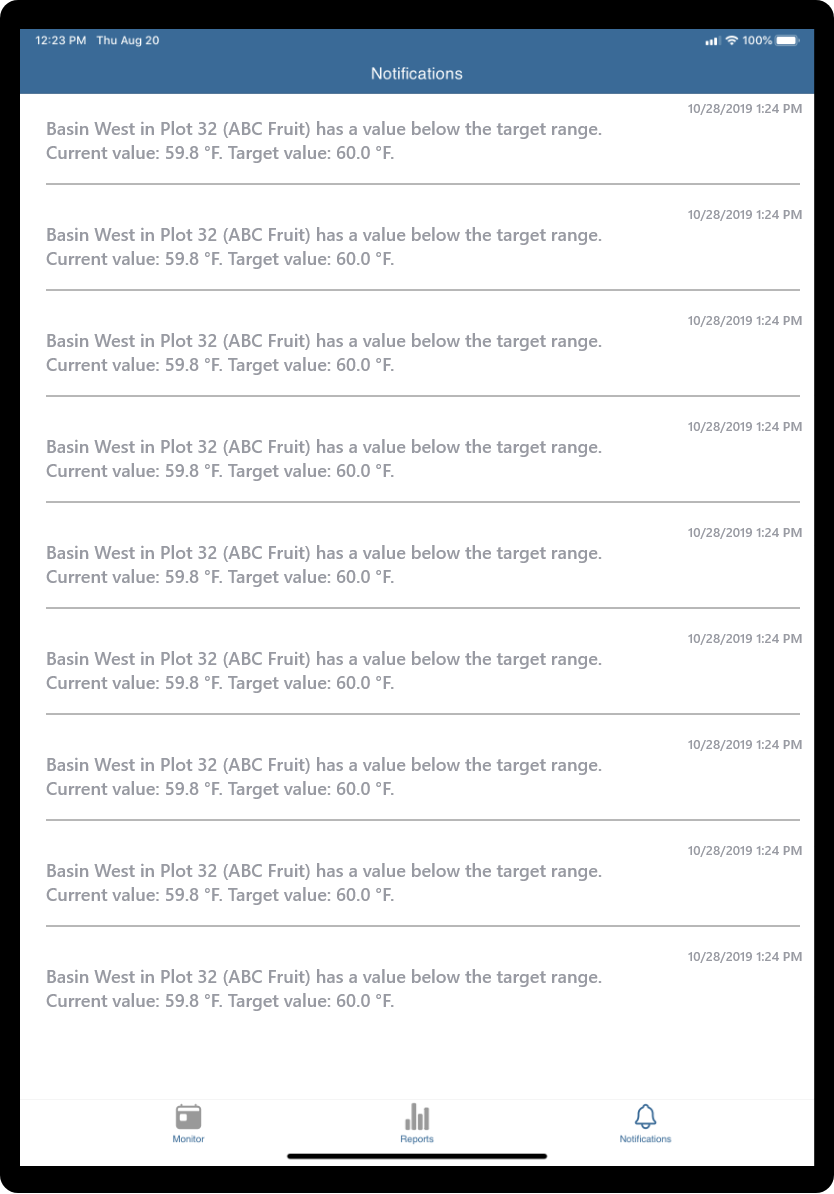
Report status notifications are shown on the notifications page.
How did we do?